Keep learning
Marketing funnel
How do you turn website visitors into qualified discovery calls on autopilot?
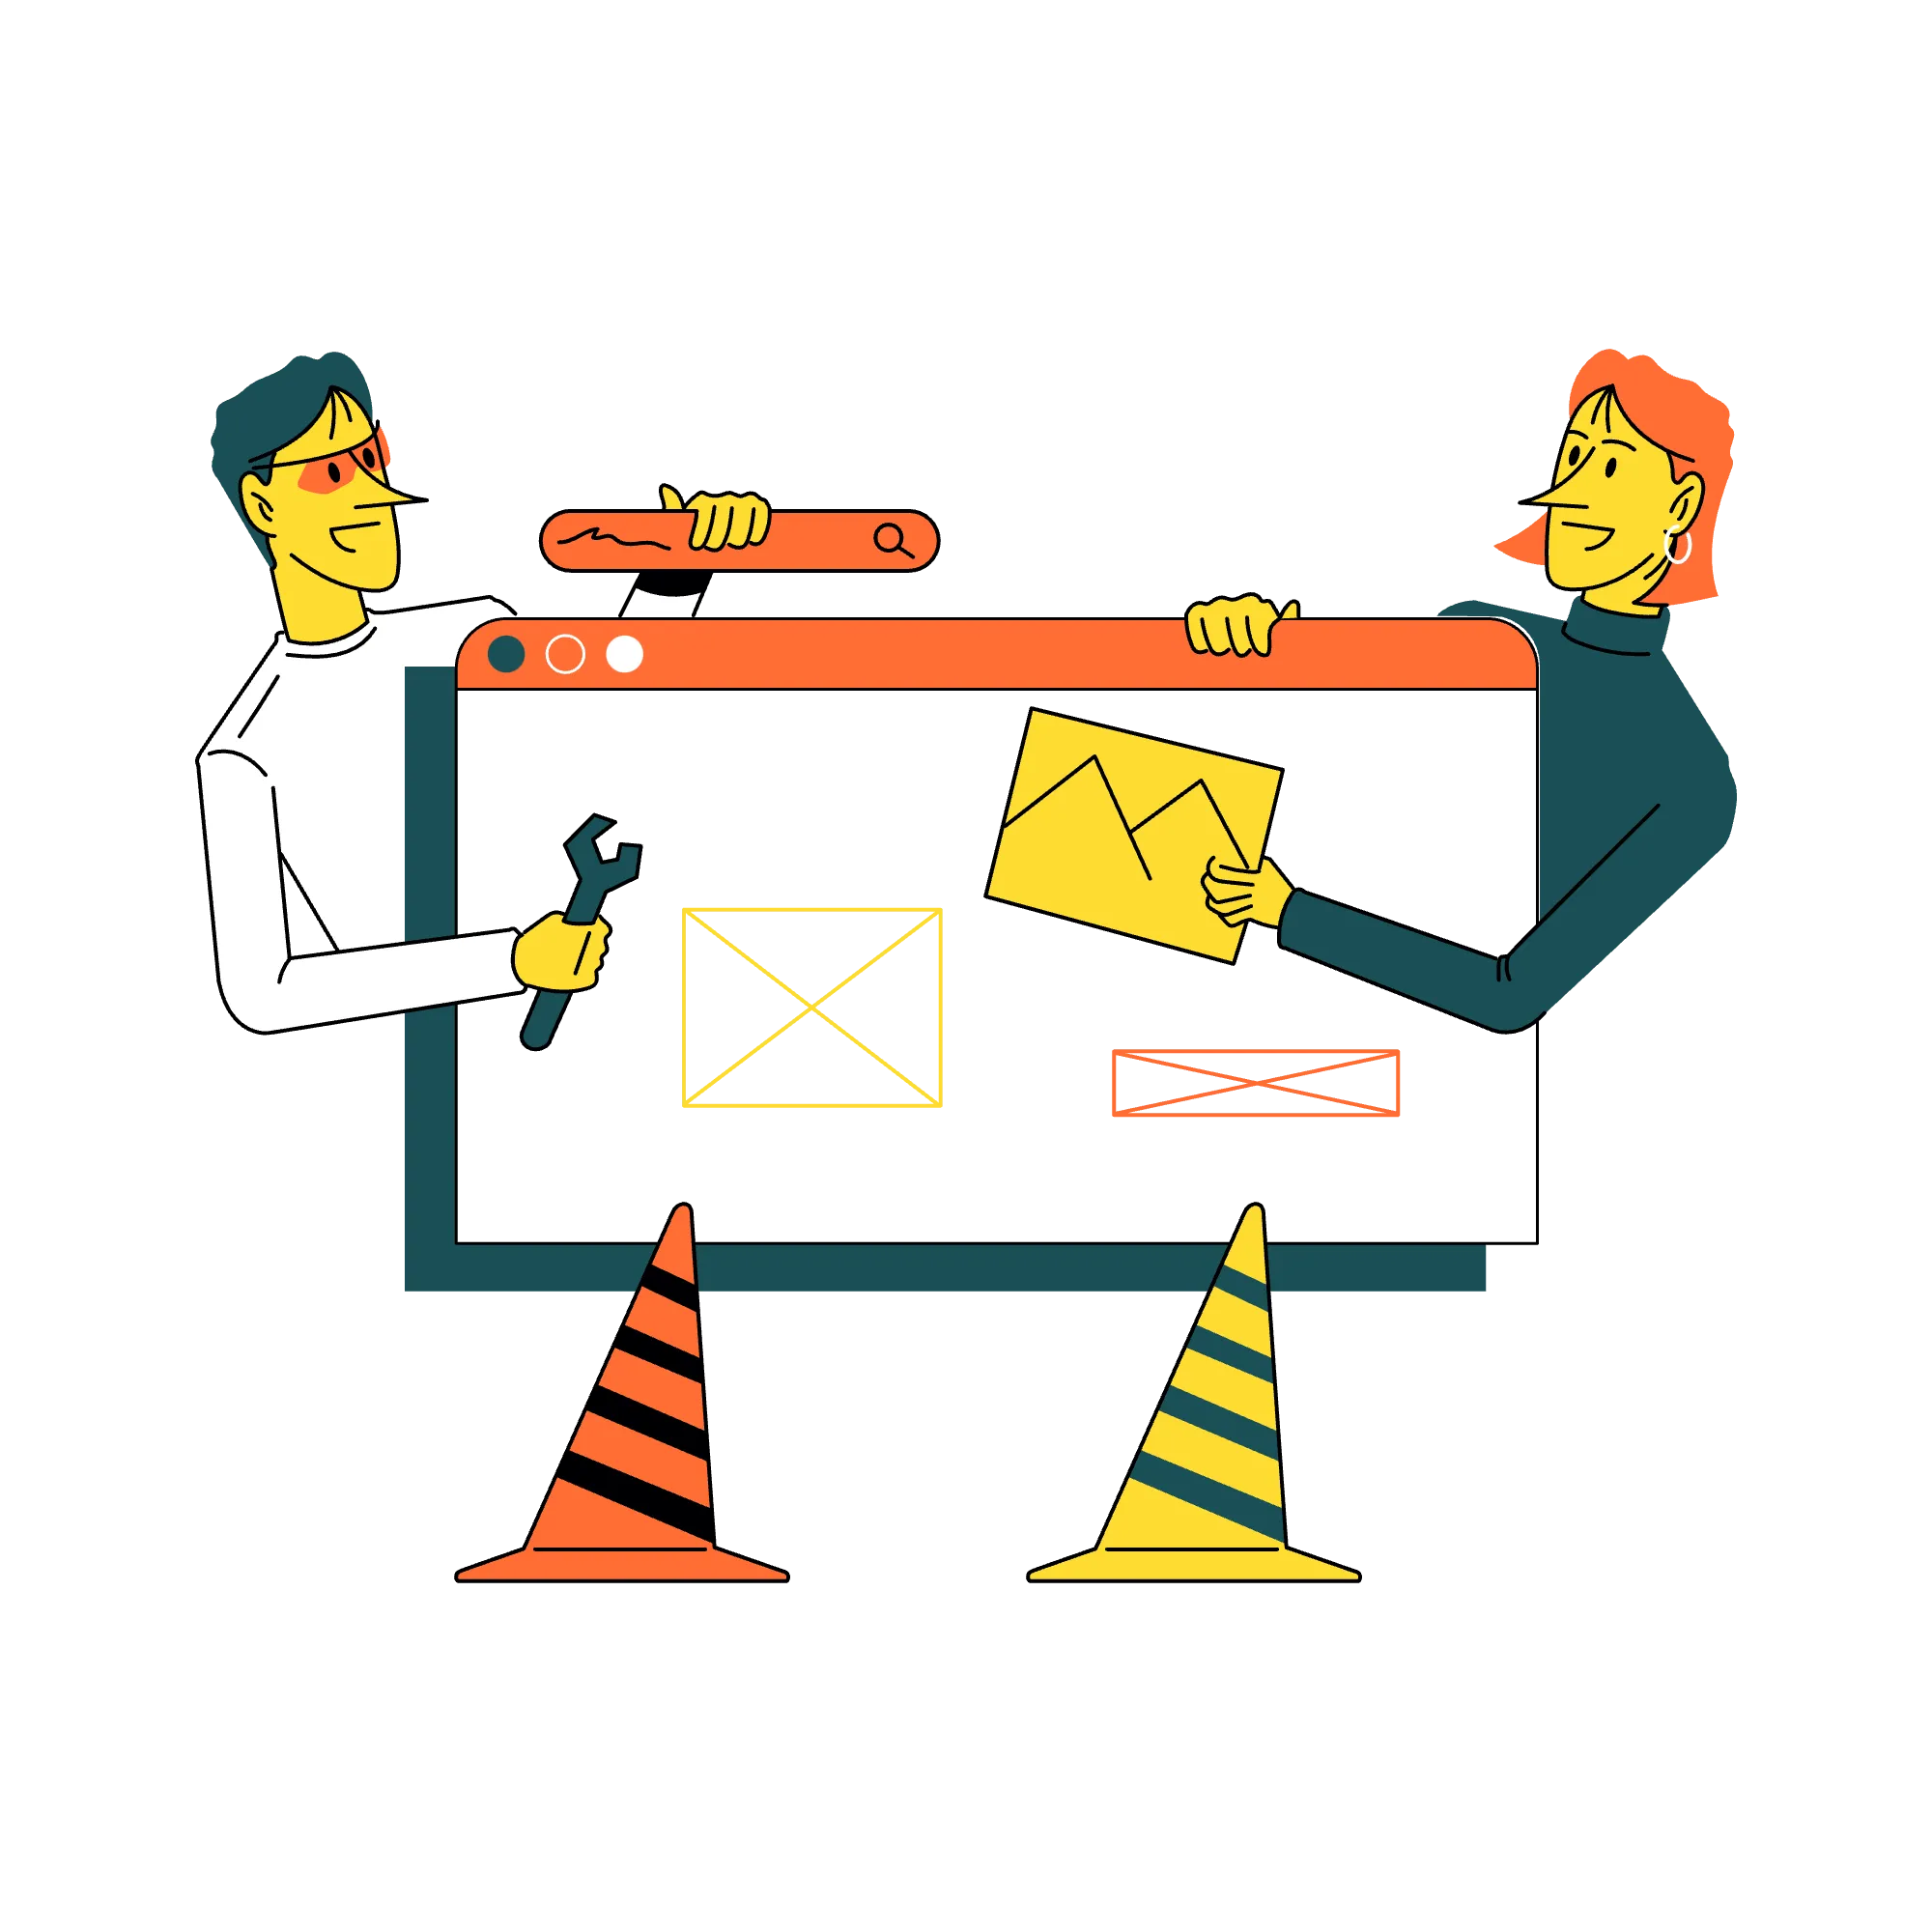
Visualise user behaviour through colour-coded overlays showing clicks, scrolls, and mouse movement, exposing hidden friction points.
.webp)
A heatmap is a visual overlay that shows where visitors act on a web page. The tool records every mouse-click, tap or scroll event, then colours the page so hot red spots mark heavy activity and blue areas show neglect. The three most common views are:
Free services such as Microsoft Clarity and paid suites like Hotjar generate these heatmaps by adding one script tag to your site. Screenshots turn abstract analytics numbers into a quick, intuitive picture: “Everyone misses the secondary call-to-action” or “Ninety per cent of visitors never see the pricing table below the fold.”
Heatmaps matter because they expose invisible friction that quantitative metrics alone cannot diagnose. Analytics tell you that conversion dropped, but heatmaps show you precisely why perhaps visitors frantically click on non-clickable elements thinking they're buttons (indicating confusing design), or perhaps your primary call-to-action sits in a cold zone nobody views (layout problem), or perhaps 90% of clicks land on a secondary, low-value element (hierarchy issue). These insights guide optimisation with surgical precision rather than guessing what to test. The visual format also democratises insights across teams: designers, developers, and marketers can all instantly grasp patterns without statistical fluency, improving collaboration and buy-in for changes. For B2B contexts especially, where traffic volumes may be modest, heatmaps aggregate hundreds or thousands of individual sessions into clear patterns, overcoming the noise of small samples. The diagnostic value appears strongest on critical pages landing pages for paid campaigns, product pages, pricing pages, checkout flows where small improvements multiply across all traffic. Organisations that routinely use heatmaps during redesigns and optimisation projects report 15-30% conversion improvements by systematically eliminating revealed friction points. The tool also prevents expensive mistakes: before investing in complete redesigns, a quick heatmap often reveals that moving one element or clarifying one button solves the problem at fraction of the cost.
Compare lightweight free options in the user behaviour tools category or choose Hotjar for deep session replay, Microsoft Clarity for cost-free volume, or another platform that fits budget and compliance needs.
Add the snippet before the closing tag, publish, and verify tracking. Most tools start collecting clicks and scroll depth within minutes.
Let the heatmap run until you collect at least 1 000 page views or another statistically comfortable size for your traffic level. Avoid acting on tiny, noisy samples.
Look for:
Log issues and hypotheses in your qualitative research workbook.
Move, resize or restyle problem elements, then rerun heatmaps after the change. Continuous cycles turn anecdotal design tweaks into evidence-based improvements.
For step-by-step setup instructions see the guides on the Hotjar and Microsoft Clarity tool pages.
How do you turn website visitors into qualified discovery calls on autopilot?

Your website works while you sleep, but only if visitors understand what you do within seconds. Build pages that answer questions before they're asked and make the next step obvious.

Implement forms, lead magnets, and conversion points strategically so anonymous traffic turns into known contacts you can nurture and qualify.

Build automated email sequences that educate leads over time, build trust at every touchpoint, and move prospects toward a buying decision at their own pace.
Create a frictionless path from interest to scheduled meeting with confirmations, reminders, and no-show handling that maximises every opportunity.
Regularly remove inactive and invalid email addresses to maintain deliverability and focus effort on engaged subscribers who actually read your content.
Capture exact language customers use to describe problems and solutions to write copy that resonates because it mirrors how your market actually thinks and speaks.
Ensure websites display and function properly on all devices to avoid losing mobile traffic that bounces from broken layouts or tiny unclickable buttons.
The percentage of marketing qualified leads who book a meeting with your sales team.
Map every touchpoint from initial awareness to repeat purchase, creating seamless experiences that guide prospects toward conversion.
Identify specific problems customers experience to position solutions around relieving frustrations they're motivated to solve rather than nice-to-have features.
The percentage of new leads who take a qualifying action and become marketing qualified leads.
Craft clear, compelling prompts that drive specific user actions across platforms, from clicking through to converting.
Share original insights and expertise publicly to build authority and attract customers who value your perspective before they need your solution.
Optimise how quickly pages load to reduce bounce rates and improve rankings since slow sites frustrate users and get penalised by search algorithms.
Structure your pricing, deliverables, and guarantee into a compelling proposition that makes buying decisions easier and more confident.
Plan content publication in advance to maintain consistency, balance topics, and coordinate promotion rather than scrambling to create content reactively.
Visualise user behaviour through colour-coded overlays showing clicks, scrolls, and mouse movement, exposing hidden friction points.
Place critical information and calls-to-action in the visible area before scrolling to capture attention immediately when visitors land on pages.
Map the buyer journey from attention to action, crafting messages that guide prospects through each stage to conversion.
Conduct structured conversations with customers to uncover problems, motivations, and decision processes that surveys and analytics can't reveal.
Understand the underlying progress customers try to make by hiring products to uncover motivations that drive purchases beyond surface-level features.
Display security badges, guarantees, and credentials to reduce purchase anxiety and prove legitimacy on pages where visitors make buying decisions.
Execute personalised, multi-touch campaigns at scale through software that triggers messages based on prospect behaviour and characteristics.
Build professional reputation through consistent content and engagement to attract opportunities and establish trust before commercial conversations begin.